

If you run Microsoft Fabric at any real scale, you already know the monitoring story is scattered. Capacity sits in one app, activity logs live behind an admin API, workspace inventory hides in the Scanner API, and tenant settings are their own screen. FUAM, short for Fabric Unified Admin Monitoring, is the open-source answer to that.
FUAM collects those feeds into a single Lakehouse on your own capacity and puts Power BI reports on top.
FUAM is a community-built accelerator that pulls your whole Fabric tenant into one Lakehouse.
This is a practitioner’s look at what the tool does, where its data comes from, how it stacks up against the first-party Capacity Metrics app, and the part most write-ups skip: what it costs in real capacity units.
What is FUAM, and why it exists
FUAM is a solution accelerator, not a product. It started as a community project and now lives inside Microsoft’s fabric-toolbox repository under an MIT license, where it’s actively developed. That distinction matters. There’s no SLA, no support queue, and no promise that a given release won’t break. If something goes wrong, you file a GitHub issue and wait.
So why run an unsupported tool? Because the native pieces were never built to talk to each other. The Capacity Metrics app watches CUs, the admin monitoring workspace covers a slice, the Scanner API returns inventory as raw JSON, and none of them share a model. It exists to stitch those feeds together and keep the history, so a platform team can answer tenant-wide questions from one place.
Everything is assembled from Fabric items you already recognize. Pipelines and notebooks handle extraction and transformation, a Lakehouse stores the results in Delta Parquet, and two semantic models feed the reports in Direct Lake mode. Because the raw tables sit in your own Lakehouse, you can query them straight from the SQL endpoint or build your own model next to the ones that ship.
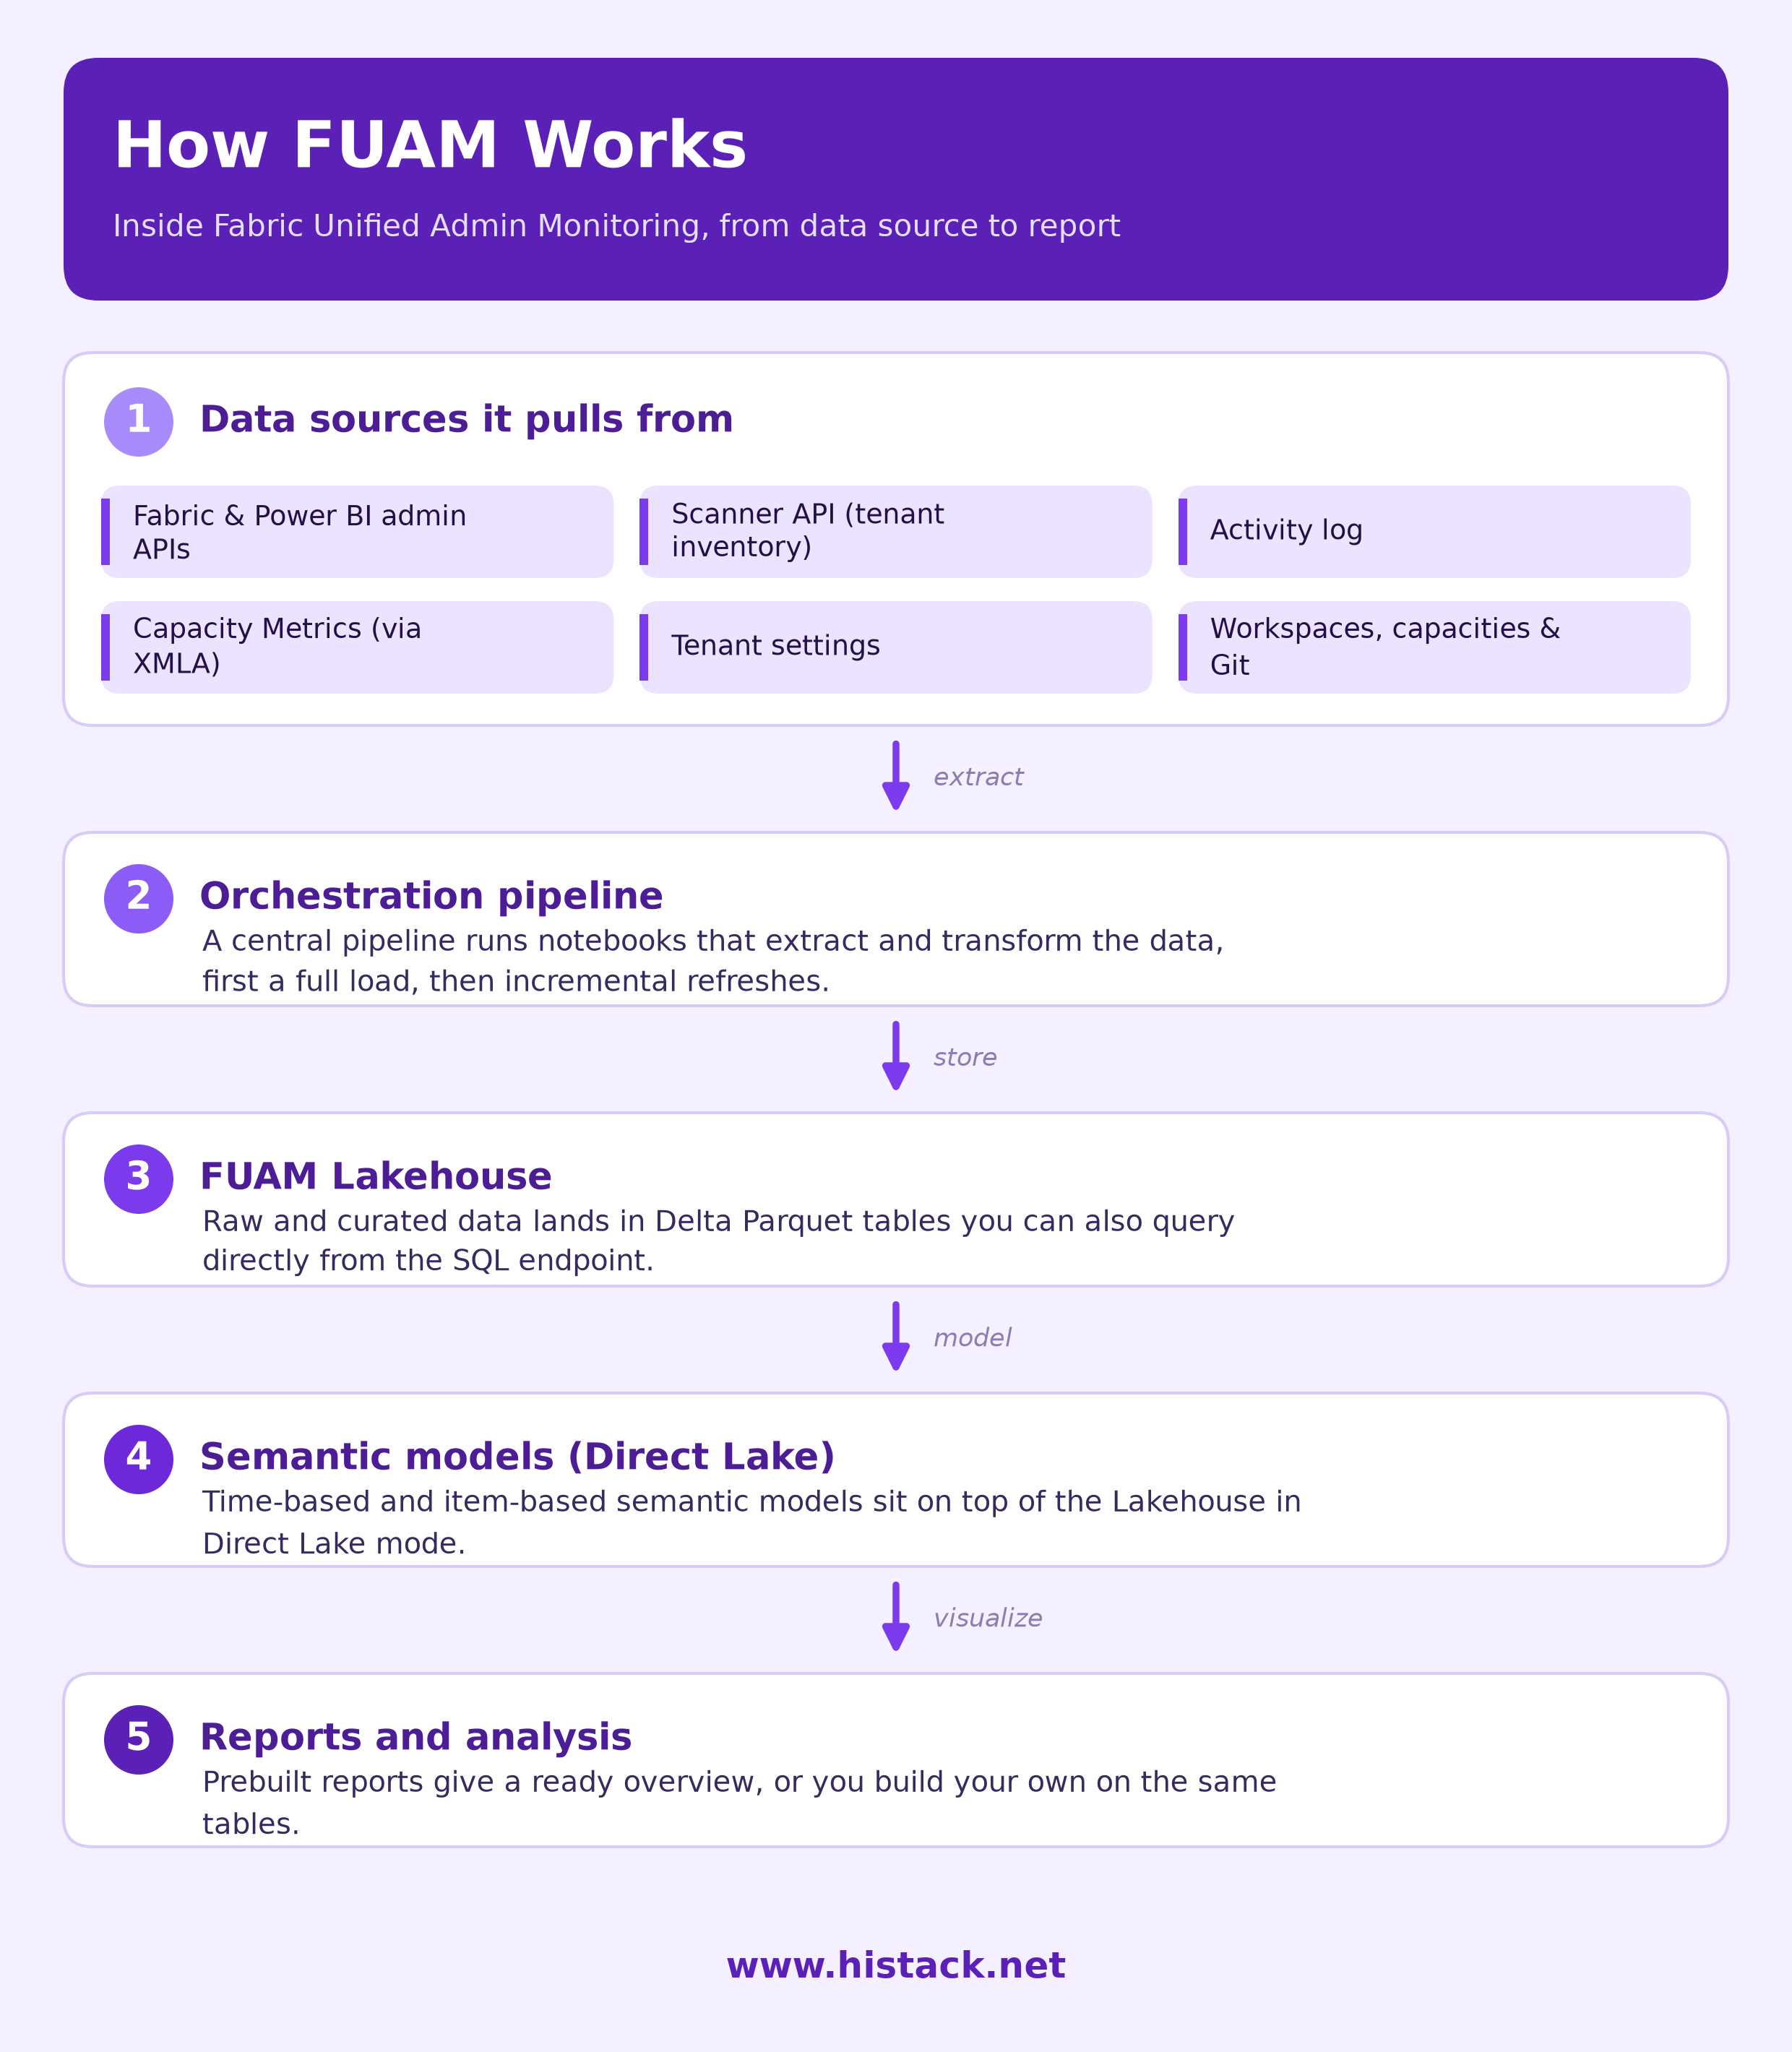
What it monitors by FUAM: capacity, activity, and inventory
One orchestration pipeline, Load_FUAM_Data_E2E, drives the whole collection process and handles both the first full load and later incremental runs. Beneath it sit a set of modules, each responsible for one slice of the tenant:
Capacities — capacity properties and the users assigned to them.
Capacity Metrics — CU consumption by timepoint and by item kind per day, pulled from the Capacity Metrics app’s semantic model over XMLA.
Activities — the tenant activity log of user actions, plus a rolling 30-day aggregate.
Inventory — a full tenant scan via the Scanner API: semantic models, lakehouses, warehouses, reports, and the rest of your items.
Tenant settings — snapshots of tenant and delegated settings, so you can see what changed and when.
Workspaces, refreshables, and Git connections — which workspaces exist (personal ones excluded), what’s scheduled to refresh, and which workspaces are wired to source control.
That combination is what turns it into Fabric tenant monitoring rather than plain capacity watching. You get Fabric capacity utilization monitoring sitting in the same model as your inventory and activity history, which is exactly the join you can’t easily make when every source lives in a separate tool.
A newer optimization module (still beta) goes a layer deeper, pulling Best Practice Analyzer and VertiPaq Analyzer results for semantic models. Near-real-time CU tracking through Capacity Utilization Events is on the roadmap but hasn’t shipped.
What you can actually do with FUAM
Collection is only half the point. The reason to stand this up is the questions it lets you answer across a whole tenant instead of one capacity at a time. A few things the standard reports and model make straightforward:
Track long-term CU utilization well beyond the roughly 14 days the Capacity Metrics app keeps, so you see seasonality and growth instead of just the last two weeks.
Rank the items driving consumption. The item-level report and model let you sort semantic models, reports, and pipelines by the load they put on a capacity.
Spot orphaned content by cross-referencing inventory against activity, which is how you find the fifty workspaces nobody has opened in months.
Audit tenant settings over time and trace who’s been active where.
Extend any of it. Since the Lakehouse is yours, you can join FUAM’s tables to your own chargeback data or a CMDB and build reports the shipped ones don’t cover.
That last point is the real draw for teams with a data engineer on hand. The bundled reports are a starting layer, and the capabilities you actually want tend to be the ones you build on top of the raw tables.
FUAM vs the Fabric Capacity Metrics app
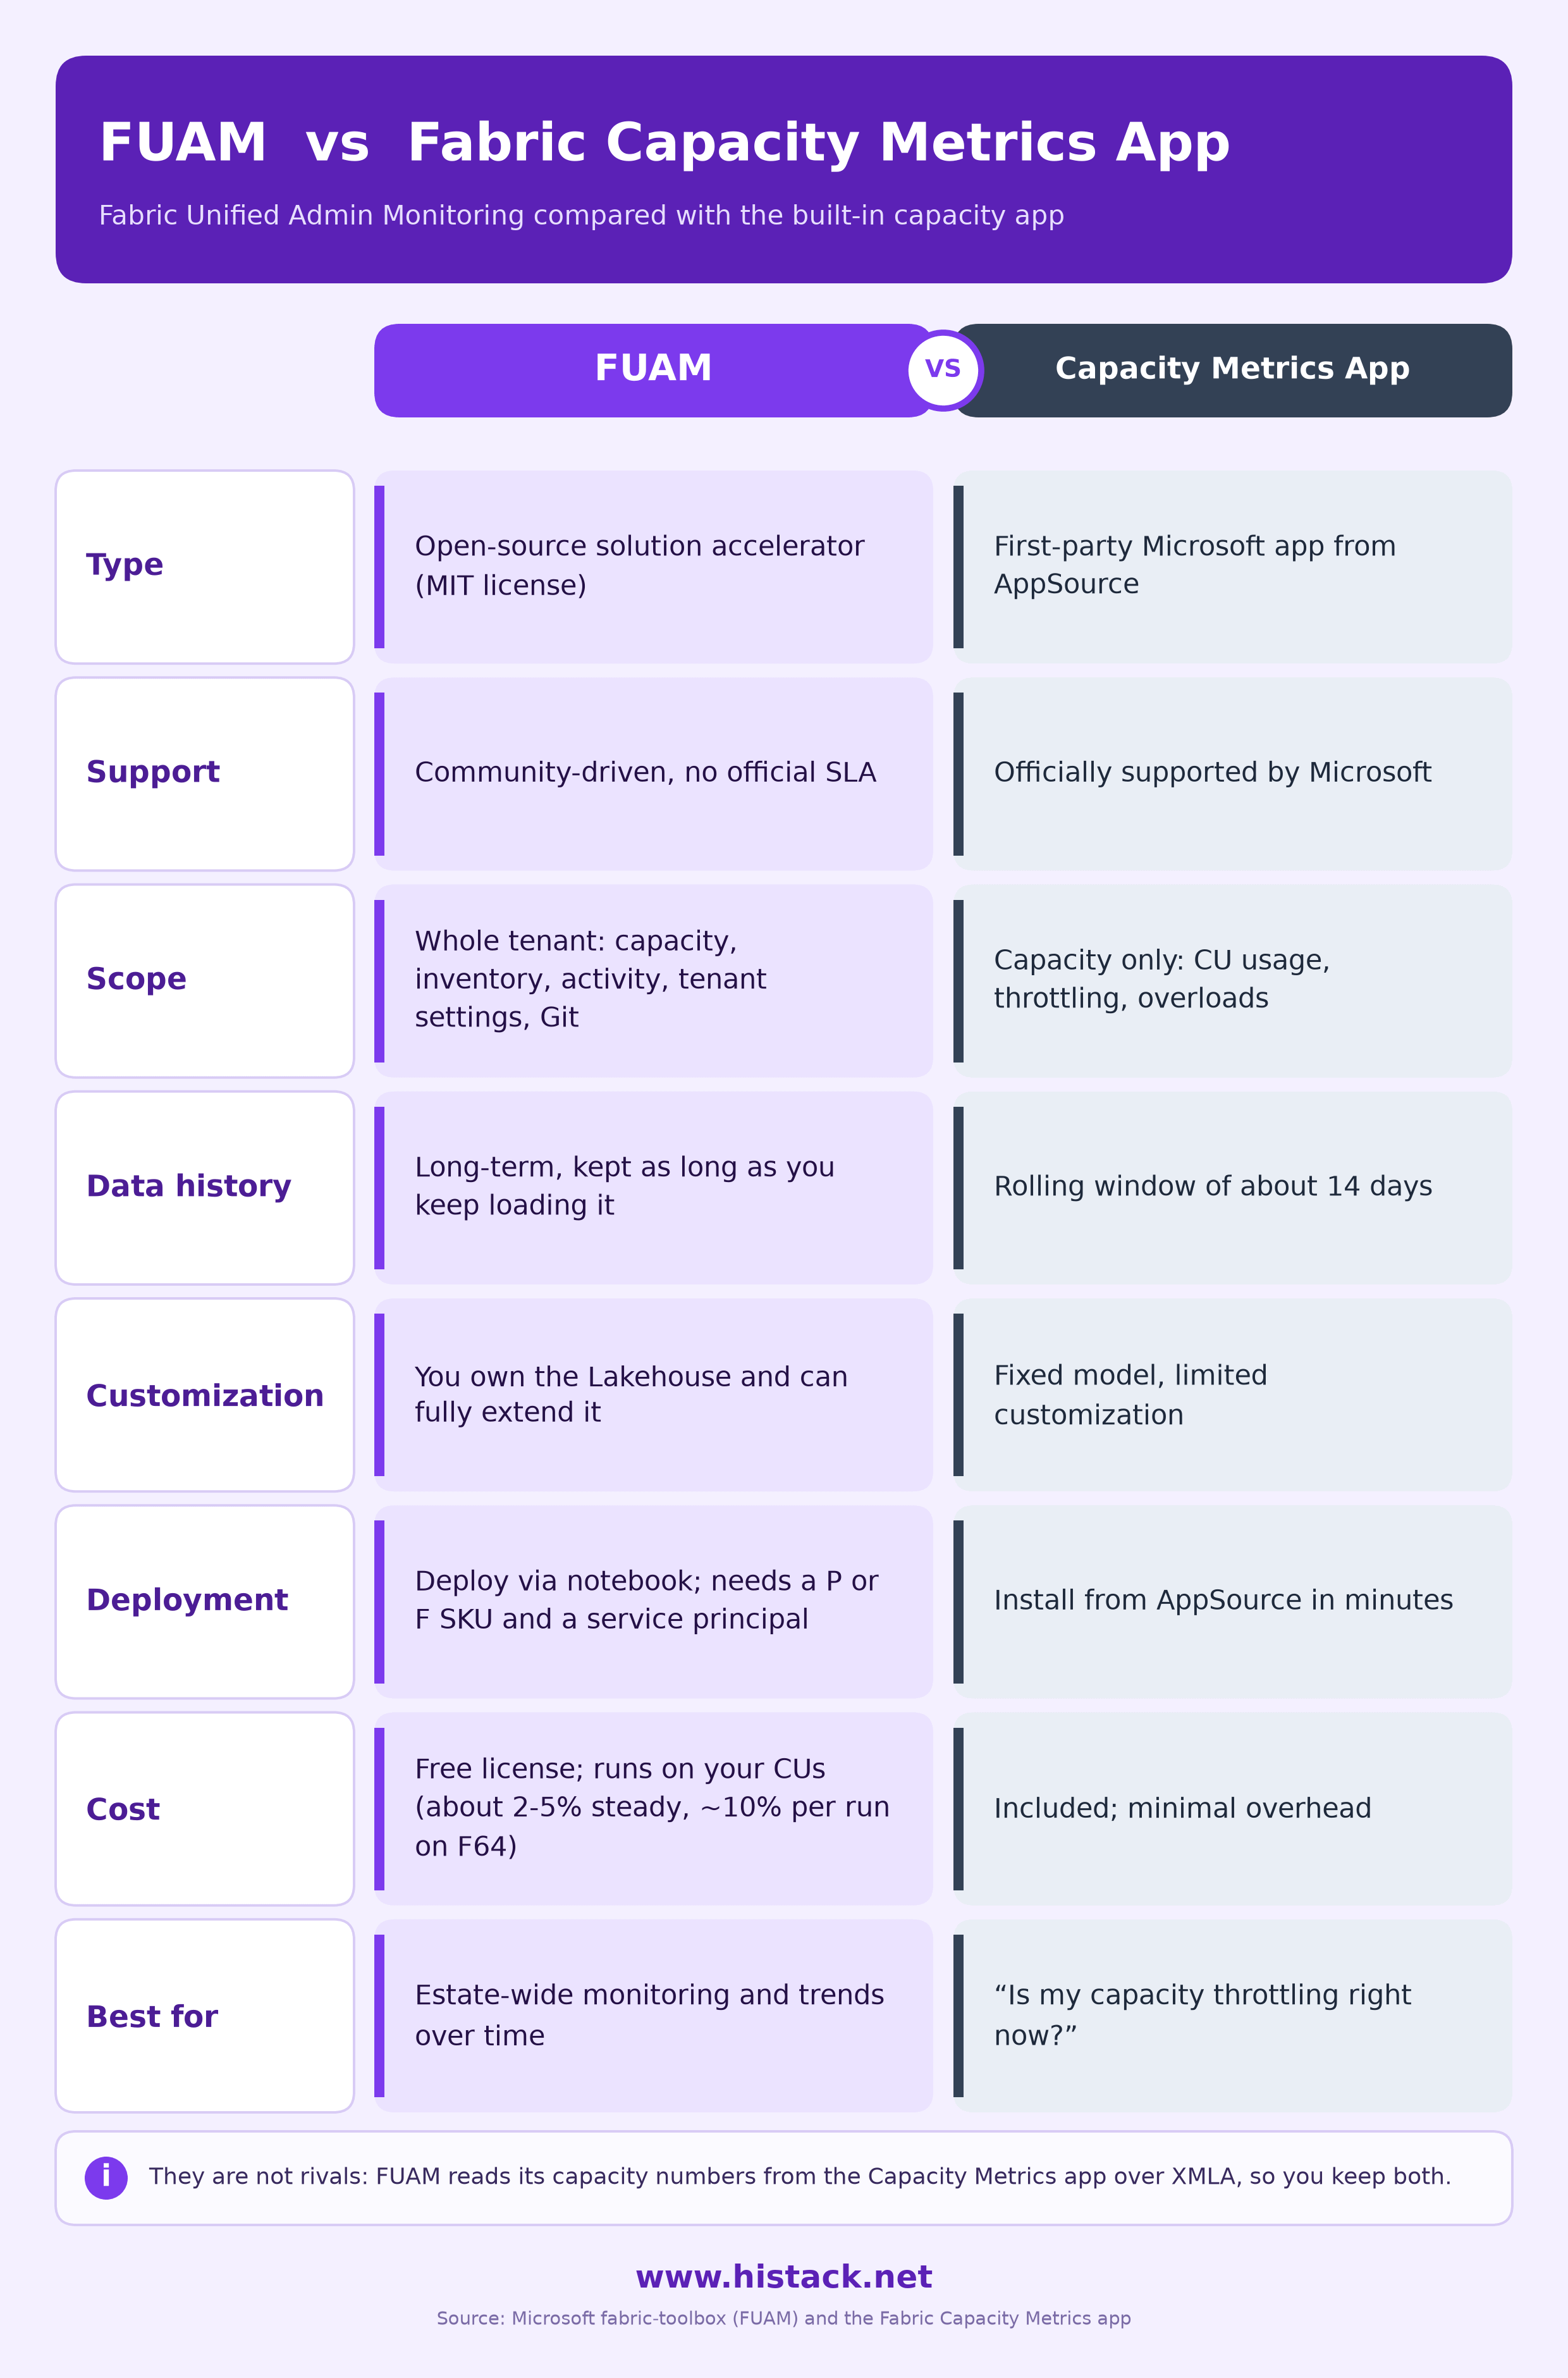
This is the comparison people ask for most, and the usual framing is off. These two aren’t competitors. One depends on the other.
The Capacity Metrics app
First-party, Microsoft-supported, installed from AppSource.
Focused on capacity: CU usage, throttling, overloads, interactive versus background operations.
Short retention (a rolling window of roughly 14 days) and a fixed model you don’t really customize.
The right tool for “is my capacity throttling right now, and why.”
Fabric Unified Admin Monitoring
A community accelerator you deploy and own, with no official support.
Tenant-wide: capacity plus inventory, activities, tenant settings, refreshables, and Git connections in one model.
Long history, kept as long as you keep loading it, and fully open to extend.
The right tool for “what’s happening across my whole estate over time.”
Here’s the catch worth stating plainly. FUAM reads its capacity numbers from the Capacity Metrics app’s semantic model through the XMLA endpoint, so you need that app installed and a compatible build (the docs call out specific versions such as v65, v53, v47, and v44 or earlier). Because that extraction rides on the app’s internal model, a change on Microsoft’s side can break the feed without warning. Keep the app, and treat it as the layer that unifies everything around it.
What FUAM costs to run
The software is free. There’s no license and no per-seat charge. The cost is capacity, because every pipeline run, notebook execution, and report query burns CUs on the Fabric capacity you deploy it to, plus a small OneLake storage footprint for the Delta tables.
You need a P or F SKU to run it. PPU and Pro shared workspaces aren’t supported, and deployment also needs a service principal, Fabric admin rights, and the XMLA endpoint enabled on the Capacity Metrics app.
So what does it actually consume? Real-world figures from practitioners running it on an F64 land in a fairly consistent range. Treat these as community reports, not official Microsoft numbers:
Steady state stays low, often around 2 to 5% of capacity over time.
A single scheduled run tends to sit near 10% of CU while the pipeline is active.
The initial backfill is the heaviest moment and can touch 10 to 15% for a short window, depending on how much history you pull and how many workspaces you scan.
Storage is negligible next to compute.
Consumption scales with metadata volume, not raw data size, so more workspaces and more activity mean longer notebook runs. Two things bite people. Over-scheduling is the first. Running the pipeline every few minutes is rarely worth it, and every 30 to 60 minutes (or even twice a day) covers most admin needs. The shipped semantic model is the second. It isn’t tuned well, and at least one team reported a single report filter nearly pushing an F64 into throttling, which is a strong argument for building your own model on the tables.
Takeaway: FUAM is free to license but not free to run. Budget a few percent of a mid-size capacity for steady state, schedule it off-peak, and load incrementally after the first backfill.
FUAM Limitations
This earns its place when a single capacity app stops being enough: multiple capacities, a growing tenant, governance questions that need history, or a platform team that wants everything queryable in one Lakehouse. For one small capacity, the native app plus built-in workspace monitoring may be all you ever need.
Know the limits before you commit:
No official support. It’s community-maintained, so budget time to read code and follow releases.
Not real-time. Collection is batch, and freshness follows your schedule. Near-real-time CU events are still on the roadmap.
It leans on the Capacity Metrics app. Version drift there can break the capacity feed.
The default model needs work. Plan to tune or replace it before you point many users at it.
It competes for the capacity it measures. A common recommendation is to give the tool and the Capacity Metrics app their own small capacity, so a production overload doesn’t also blind the thing you use to diagnose it.
Deployed with those constraints in mind, Fabric Unified Admin Monitoring turns a pile of disconnected admin surfaces into one model you control. For anyone running Fabric past a single capacity, that consolidation is worth the setup, as long as you go in treating it as an accelerator you own rather than a product someone else supports.